
Robotic Hand
Results at a glance Aggregate Plant 1

Corrected
Power Factor
53% → 93%
Changed monthly penalties to bonuses

Penalties Eliminated
21%
Of the total bill cost due to reactive power charges removed

Production Unlocked
+32%
Higher output with only +8% bill increase

Transformer Capacity Freed
127 kVA
Avoided the installation of a second unit
Aggregate Plant 2
Corrected
Power Factor
63% → 96%
Changed monthly penalties to bonuses
Penalties Eliminated
20%
Of the total bill cost due to reactive power charges removed
Production Unlocked
+12.5%
Higher output with a -19% bill decrease
Transformer Capacity Freed
99 kVA
Avoided the installation of a second unit
Overview
While supporting operations at my family’s construction company, I identified a critical bottleneck at two active aggregate sites: chronically low power factor (0.53 lagging) that triggered 21% utility penalties over the electricity bill, restricted production, and threatened the need for a costly new aditional transformer to expand production.
With no local experts available and no access to professional power-quality analyzers, I took full ownership of the solution. Having only theoretical knowledge from university and never having designed or commissioned a power factor correction system before, I bridged the gap from textbook exercises to real industrial implementation — sourcing every component myself despite significant challenges.
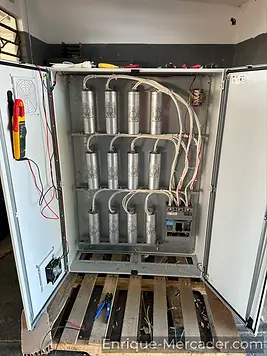
I discovered a 15-year-old automatic capacitor bank that had been completely abandoned: all capacitors had failed due to years of zero maintenance, the unit was switched off, and the original banks were severely undersized for the expanded plant. I refurbished it into a modern 12 capacitor hybrid system delivering 240 kVAR of dynamic correction. Using only a Fluke clamp multimeter and the utility bills, I tuned it to a stable 0.96 power factor across the full load range.
Simultaneously, I designed and built a complete 240 kVAR fixed capacitor bank from scratch for the second aggregate site — fully commissioned in just 48 hours.
These interventions eliminated all penalties, freed ~132 kVA of transformer capacity, and unlocked 32% higher production with almost no increase in energy costs — without external consultants or new equipment.

Development Process

1
Field Diagnostics
Measured phase currents at the main transformer using a Fluke 378 Clamp Multimeter and cross-referenced utility data.
6
Internal Mounting
Securely mounted capacitors, main breaker, and control transformer inside the cabinet.

11
Performance Validation
Verified stable 0.96 power factor on the refurbished bank’s analyzer panel after full expansion.
2
Procured Materials
Sourced high-spec 20 kVAR capacitors, contactors, breakers, cooling systems, and protection devices for both banks.

7
Thermal Design
Cut ventilation sections for cooling fans and filters to ensure optimal thermal stability.

12
Full Production Lines
Enabled simultaneous operation of all aggregate conveyors at maximum capacity.
3
Automatic Bank Rebuild
Installed the new 20 kVAR capacitors in the legacy automatic bank during a 2-hour shift window.

8
Wiring the Capacitors
Completed point-to-point wiring of all capacitor stages to the main breaker.

13
Crushing Operation
Primary crusher and feeding conveyor now running continuously at peak performance.

4
Fixed Bank Enclosure
Prepared the rugged industrial cabinet to house the new 240 kVAR fixed capacitor bank.
9
Completed Fixed Bank
Fully assembled, wired, and tested the 240 kVAR fixed capacitor bank.

14
Second Quarry Crusher
Heavy-duty crusher operating at full load with reliable power quality in the second aggregate site.

5
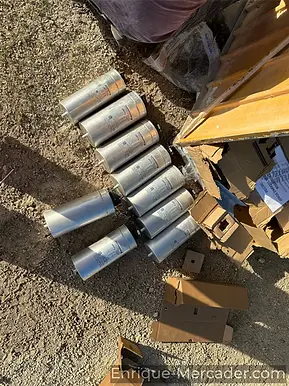
Components Ready
Laid out the 12 × 20 kVAR capacitors, main breaker, and mounting rails.

10
Completed Fixed Bank
Fully assembled fixed capacitor bank ready for delivery to the job site.
Technical Deep Dive
Power Factor Fundamentals
What is Power Factor?
What is Power Factor?
Every industrial power system runs on alternating current (AC), where voltage and current oscillate as smooth sine waves. The voltage and current should ideally rise and fall together (Fig. 1). But in real life they often get out of sync — the current lags behind the voltage by a phase angle.
Real power (P) is the useful work — the kilowatts that actually make everything like motors and conveyor belts work.
Reactive power (Q) exists in two opposing forms: inductive (lagging, created by motors, transformers, and any inductive load) and capacitive (leading, created by capacitors). When equal in magnitude, these two types perfectly cancel each other out, reducing the total reactive power the utility must supply.
Apparent power (S) is the total power the utility must deliver:
Power Factor is simply how much of that apparent power is actually useful:
The visual that makes this concept crystal clear is the Power Triangle (Fig. 2). The horizontal leg is real power, the vertical leg is reactive power, and the hypotenuse is apparent power. The smaller the angle, the closer the PF gets to 1.0 (perfect unity).
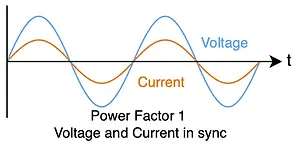
Figure 1: AC Voltage and Current graph
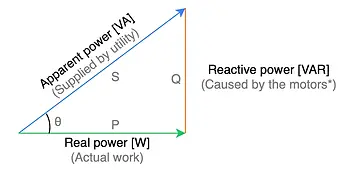
Figure 2: The Power Triangle
The Cardboard Box Analogy
The Cardboard Box Analogy
A perfect everyday analogy makes this crystal clear: Imagine real power as the actual object you need to deliver (the useful work). Apparent power is the cardboard box that contains it. The goal is a box sized as closely as possible to the object inside as to not waste space. But when there’s empty space inside the box (reactive power), delivery services have to spend far more on fuel, trucks, storage, handling, and infrastructure to transport mostly empty boxes. That extra cost and effort is exactly what utilities face with low power factor.

Figure 3: Small object in a big box
What causes reactive power and why do utilities hate it?
What causes reactive power and why do utilities hate it?
Almost every piece of equipment in industrial environments: induction motors, transformers, welding machines, and variable-frequency drives (VFDs). Their internal magnetic fields require a magnetizing current that lags the voltage by nearly 90°. The bigger or more numerous the loads, the larger the lag — and the lower the PF.
Utilities hate low power factor because it forces them to push up to 44 % more current through the entire grid to deliver the same real power. This creates higher I²R heating losses, voltage drops, and requires oversized infrastructure across the network.
You almost never see these penalties on a residential bill because home loads are small and mostly resistive. On industrial sites with hundreds of kilowatts running simultaneously, the impact is massive.
Most utilities accept a power factor of 0.90 or higher before penalties apply. The target of 0.95–0.99 is where maximum savings and compliance occur.
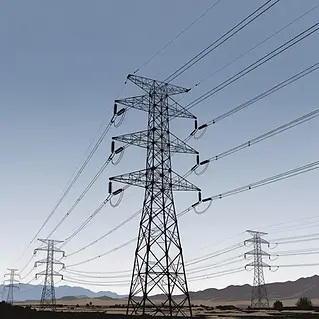
Figure 3: Transmission lines
How do capacitors fix the problem?
How do capacitors fix the problem?
A capacitor produces leading reactive power that cancels the lagging reactive power from inductive loads. By injecting the exact amount needed, the net reactive power drops to nearly zero and the current and voltage return perfectly in sync.
If too much capacitive reactive power is added, we create the opposite problem and the power factor becomes leading — the current now leads the voltage, and we are wasting energy in capacitive instead of inductive loads.
That is why precise matching is critical: only the exact capacitive compensation required at any moment delivers optimal results.
A capacitor bank is simply a group of capacitors wired together to deliver large blocks of reactive power (kVAR).
Differences Between Automatic vs. Fixed Capacitor Banks
Differences Between Fixed vs. Automatic Capacitor Banks
Once capacitors are used to cancel lagging reactive power and raise the power factor, the next decision is how to connect them: as a fixed bank or an automatic bank.
Fixed Capacitor Banks
A fixed bank consists of one or more capacitors permanently connected to the system. They provide a constant amount of leading reactive power (kVAR) at all times.
-
Advantages: Simple, low-cost, no moving parts, and zero maintenance.
-
Limitations: They only work well when the load is steady and predictable. If the load decreases, the bank can over-correct and create a leading power factor, which may also trigger utility penalties or cause voltage rise.
Automatic Power Factor Correction (APFC) Banks
An APFC bank uses a microcontroller, sensors, and contactors (or thyristors) to switch groups of capacitors in precise steps. The system continuously monitors the power factor and adds or removes kVAR exactly as needed in real time (typically within 200 ms).
-
Advantages: Handles rapidly changing loads, prevents over- or under-correction, and maintains the target power factor under all operating conditions.
-
Limitations: More complex and expensive, with additional components (controller, relays, detuned reactors) that require occasional maintenance.
In summary, a fixed bank is the optimal choice for constant, predictable loads, while an automatic bank is essential for variable industrial environments where equipment starts and stops independently. Selecting the right type ensures maximum efficiency, compliance, and cost savings without introducing new problems such as leading power factor or resonance.
Project Context & Engineering Objectives
Aggregate Plant 1: Variable Machinery Loads
Aggregate Plant 1: Variable Machinery Loads
The first aggregate plant included a rock crusher, material conveyors, a rock screening machine, a VSI crusher plant, a construction machine workshop (welding, grinding, and related tasks), and a small office. The VSI crusher was never operated simultaneously with the rock crusher and conveyors because their combined power draw approached the 300 kVA transformer limit — the site alternated between the two heavy processes to avoid overload.
This operational pattern, combined with frequent use of electric welders and grinders in the workshop, produced highly variable reactive power demand. The utility was already planning a transformer upgrade and new contract for an adjacent cement plant due to the steadily increasing load.
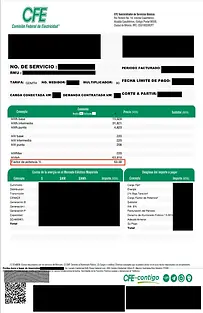
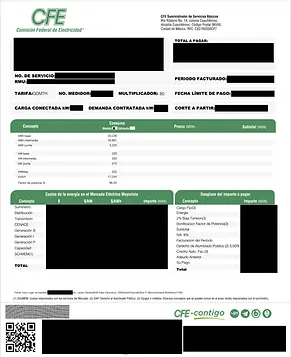
The low power factor was immediately visible on the utility bills. For the period shown, CFE calculated an average power factor of 56.48 % — well below the 90 % threshold that triggers surcharges under the GDMT tariff. This resulted in significant monthly penalties that were accumulating rapidly.
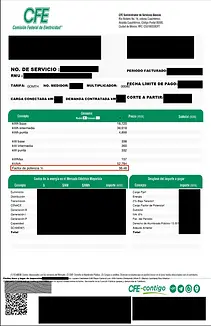
Utility Bill
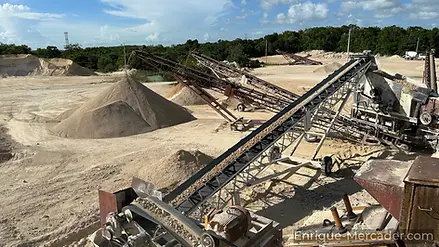
Photo of the multiple conveyors and the screener
Aggregate Plant 2: Synchronized Production Line
Aggregate Plant 2: Synchronized Production Line
The second, newer aggregate plant featured a significantly larger rock crusher, a main conveyor system, and a small office. Unlike Plant 1, the entire production line operated as a single synchronized block — the crusher and conveyor started and stopped together with no independent machinery overlap. This resulted in a steady but still critically low power factor.
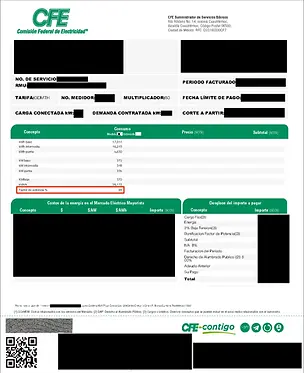
The problem was immediately evident on the utility bills. CFE reported an average power factor of 63.58 % for the period — well below the 90 % threshold that triggers surcharges under the GDMT tariff. This produced substantial monthly penalties that were accumulating quickly.
Utility Bill
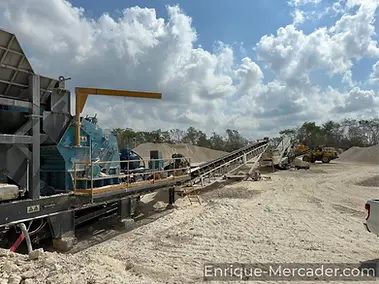
Photo of the crusher and conveyor
Engineering Targets & Success Metrics
Engineering Targets & Success Metrics
The core objective was to eliminate the low-power-factor surcharges on both aggregate plants as quickly and cost-effectively as possible while ensuring long-term reliability and compliance.
Specific engineering targets were defined as follows:
-
Raise the sustained power factor to ≥ 0.95 on both sites (above CFE’s 90 % penalty threshold and ideally into bonus territory at ≥ 95 %).
-
Achieve full elimination of monthly GDMT surcharges and qualify for the good-power-factor bonus whenever possible.
-
Limit line current reduction to at least 25–30 % compared to pre-correction levels, reducing I²R losses and peak demand charges.
-
Complete both implementations with minimal downtime (Plant 1: 2-hour window; Plant 2: within days) and total investment well below the cost of continued penalties or a new transformer.
-
Ensure long-term stability with no resonance issues or over-correction (leading PF) under normal operating conditions.
Success would be measured by:
-
Real-time controller display (Plant 1) showing PF in the 0.94–0.98 range during variable load.
-
Next utility bill showing zero penalty charges and the appearance of the good-PF bonus credit.
-
Stable operation over multiple billing cycles with no equipment failures or thermal issues.
-
Measurable reduction in apparent power demand and line currents (validated via multimeter spot-checks and bill kVARh trends).
These targets were deliberately pragmatic: achieve 80–90 % of the theoretical maximum benefit quickly rather than 100 % after months of study and higher cost. The focus was on delivering immediate ROI through penalty elimination while creating a foundation that could be scaled or upgraded later.
Load Analysis & Measurement Methodology
On-Site Measurements & Reactive Power Determination
On-Site Measurements & Reactive Power Determination
Lacking a power analyzer, I performed a site visit during full operation (crushers, conveyors, and VSI simultaneously). I measured the line voltage and current next to the transformers and calculated the apparent power in the following way:
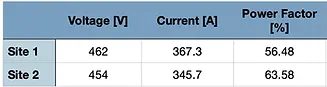
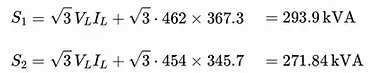
I found the apparent power for the sites, however I had no way to know the real or reactive power with the tools I had available. In the spirit of not getting stuck by that complication, I decided to use the apparent power I calculated alongside the utility bill reported power factor, because it would give me a general idea of the reactive power and based on that, even if I didn't get to the ideal power factor, I would definitely improve it and reduce the monthly fees.
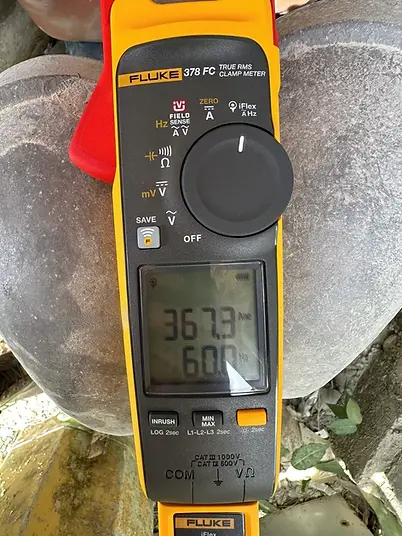
Multimeter current measurement from the first site
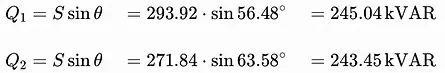
Now with the instantaneous reactive power calculated for both sites, I knew the total amount to correct, but I had no idea of how many capacitors would I need or where would I even get them from.
System Architecture & Component Selection
Capacitor Sizing Rationale
Capacitor Sizing Rationale
Finding suitable power capacitors locally proved extremely difficult, as no electrical distributors in the region carried industrial-grade units rated for 480 V and the required kVAR values. After extensive online searching, I identified a reputable distributor in Mexico that stocked a full range of EPCOS PhiCap MKP power capacitors, along with all the other materials needed for both banks (cabinet, contactors, breakers, rails, etc.).
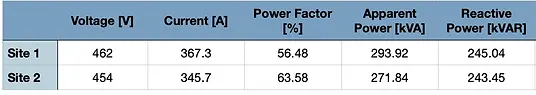
The utility bills and my on-site measurements indicated very similar reactive power requirements for both aggregate plants: approximately 245.04 kVAR for Plant 1 and 243.45 kVAR for Plant 2. This fortunate similarity simplified the sizing process considerably.
The distributor offered several capacitor sizes at 480 V: 20 kVAR, 12.5 kVAR, 10 kVAR, 7.5 kVAR, and 5 kVAR. Ideally, a bank should include a combination of different sizes to allow fine-grained compensation and minimize steps. However, time pressure was a major constraint — I needed to deliver functional correction quickly to stop the accumulating penalties, and the distributor had limited stock and delivery timelines.
After evaluating the options, I selected the 20 kVAR capacitors as the best compromise:
-
Using 12 × 20 kVAR units gave 240 kVAR total compensation — very close to the calculated 243–245 kVAR needed.
-
Larger steps reduced the number of capacitors, contactors, wiring points, and overall complexity (especially important for the fixed bank at Plant 2).
-
For Plant 1’s automatic bank, the controller could still provide reasonably good granularity with 9 switched steps (6 automatic + 3 fixed base-load).
-
For Plant 2’s fixed bank, larger individual capacitors were actually advantageous since the load was constant and synchronized — fewer components meant simpler installation and lower risk of failure points.
I later updated the Plant 1 controller software to recognize the capacitors as 20 kVAR (instead of the original 15 kVAR rating), allowing the system to use the full capacity correctly.
This pragmatic approach — choosing the largest available size that still fit the budget and timeline — delivered excellent results: both plants reached stable power factors of 0.94–0.98 and eliminated penalties entirely, while keeping the total component count and cost reasonable.
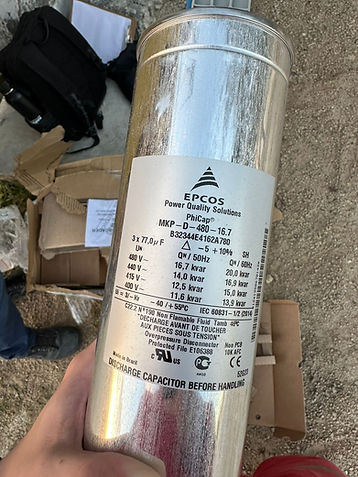
Photo of the real capacitors used
Refurbishment of Existing Bank (Plant 1)
Refurbishment of Existing Bank (Plant 1)
Plant 1’s load profile was highly variable — the rock crusher, conveyors, screening machine, and workshop equipment ran independently, while the VSI crusher operated in alternation to avoid overloading the 300 kVA transformer. This created rapid swings in reactive power demand that demanded dynamic correction.
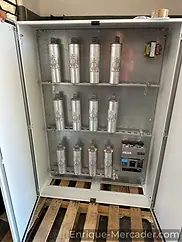
During the initial site visit I discovered an existing 15-year-old automatic capacitor bank next to the transformer. It contained nine 15 kVAR capacitors and a Computer Smart III 12-step controller. All capacitors were completely dead (confirmed by safe discharge and multimeter testing), and the bank had been powered off and unmaintained for years.
I decided to refurbish the existing panel rather than build a new one from scratch — the enclosure was in good condition, the breakers were good, and the contactors were still functional and rated for up to 25 kVAR per step. This saved significant cost and time.
The refurbishment focused on replacing only the failed components and making targeted improvements:
-
Replaced all nine capacitors with new Siemens/EPCOS PhiCap 20 kVAR units at 525 V (total switched capacity 180 kVAR).
-
Replaced the two 8" ventilation fans and their filters (the originals were dead).
-
Added a dedicated manual breaker to allow operators to control the three fixed capacitors independently (total fixed capacity 60 kVAR).
-
Updated the controller software to recognize the new 20 kVAR capacitor rating.
The original plan was to expand the bank to 12 automatic steps. However, after evaluating time, cost, and actual site needs, I recommended a hybrid approach: keep 9 steps in the automatic bank (6 switched + 3 fixed base-load) and let the operators manually enable the fixed group when the main machinery was running. The automatic portion would then fine-tune the final power factor. This compromise provided excellent stability for the variable loads while keeping the project fast and affordable.
The total cost for the refurbishment was $3,008 USD ($55,646.38 MXN) — dramatically lower than a new automatic bank, yet fully effective.
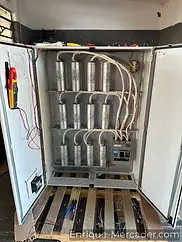
The work was completed in a tight 2-hour window between crews (during machine greasing downtime). I locked out and tagged both the main breaker and the internal bank breaker for safety. Upon re-energizing, the controller immediately displayed real-time power factors between 0.94 and 0.98 — fluctuating with crusher load but consistently well above the penalty threshold.
The removed and obsolete capacitors
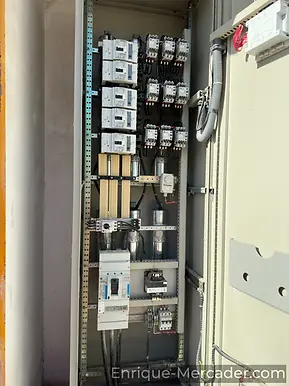
The refurbished capacitor bank
Fixed Bank Design (Plant 2)
Fixed Bank Design (Plant 2)
Plant 2 operated as a single synchronized production line — the large rock crusher and conveyor system activated and deactivated together with no independent machinery overlap. This steady, predictable load profile made an automatic switching system unnecessary and would have added significant cost and complexity without meaningful benefit.
After presenting both options (a new automatic capacitor bank reverse-engineered from the one on the first site vs. a new fixed bank), the fixed design was selected for its lower cost, simpler installation, and comparable performance under the plant’s operating conditions.
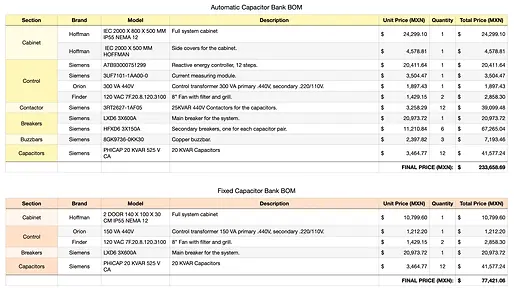
I designed and built the complete fixed capacitor bank from scratch. All major components were sourced from the same Mexican distributor that supplied the Plant 1 capacitors:
-
Full system cabinet (Hoffman 2-door IP55 NEMA 12)
-
Control transformer (Orion 150 VA, 440 V primary to 220/110 V secondary)
-
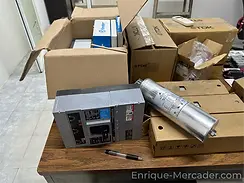
Main breaker (Siemens LXDX6 6000 A)
-
12 × 20 kVAR EPCOS PhiCap capacitors at 525 V (total 240 kVAR compensation)
-
Ventilation (2 × 8" Finder fans with filters and grilles)
-
Mounting rails, brackets, screws (purchased locally at Home Depot)
The BOM totaled $4,184.92 USD ($77,421.06 MXN) — roughly one-third the cost of the automatic alternative (12,630 USD - $233,658.69 MXN) while delivering nearly identical reactive compensation (243.45 kVAR required vs. 240 kVAR installed).
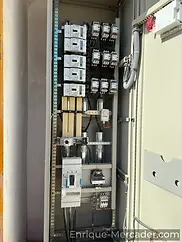
Assembly took two days with assistance from one general technician from the workshop. I handled all electrical design, component mounting, wiring, labeling, and testing. The bank was installed directly at the distribution board to minimize cabling losses and simplify commissioning.
On the next utility bill, Plant 2 achieved a period power factor of 0.96, eliminating the low-PF penalty and qualifying for the good-power-factor bonus — exactly the outcome we needed with the minimum investment and complexity.
The finished capacitor bank
Challenges, Business Impact & Lessons Learned
Key engineering hurdles & solutions
Key engineering hurdles & solutions
The biggest challenge was the complete absence of proper diagnostic equipment. No power analyzer was available to rent, borrow, or purchase locally, and buying one for a one-off project was not feasible. Standard methods (oscilloscope + shunt resistors) work in a lab but are impractical and unsafe on a live 480 V three-phase industrial site where operations cannot be interrupted.
I had to improvise with basic tools (multimeter for voltage and current measurements) and the utility bill data as the only reliable baseline. This forced conservative assumptions: I treated the long-term average power factor (0.5648) and period apparent energy as a proxy for worst-case instantaneous conditions. The calculated reactive compensation (~245 kVAR) was therefore intentionally oversized to ensure safe margins.
Another hurdle was the severely degraded state of the existing automatic bank at Plant 1 — all nine capacitors were failed, the ventilation fans were dead, and the system had been offline for years. Replacing only the failed components (capacitors and fans) while reusing the still-functional 25 kVAR-rated contactors kept costs and downtime low.
Harmonic distortion was a known risk with welders and large motors present on both sites. Without harmonic measurement capability I could not quantify or mitigate it fully, but I prioritized action: achieving 80–90 % correction quickly was far better than waiting for perfect data and doing nothing. Detuned reactors were considered but omitted to maintain speed and budget; the final results (stable PF above 0.94) showed the trade-off was acceptable.
Time pressure was constant — Plant 1’s refurbishment had to be completed in a strict 2-hour window between crews, and Plant 2’s fixed bank had to be designed, sourced, assembled, and installed in days. Every decision balanced speed, cost, safety, and performance.
These constraints turned into strengths: by focusing on what was achievable with the resources at hand, both plants reached excellent results without over-engineering or overspending.
Takeaways
Takeaways
Before this project I only knew power factor correction from university theory. I understood the concept — use capacitors to cancel lagging reactive power — but I had never worked with industrial power capacitors, never seen one in person, and had no idea where to source them or how they were installed in a 480 V three-phase system. My experience was limited to DC capacitors in lab setups and small electronics projects. I jumped in anyway, because the problem needed solving and nothing ventured, nothing gained.
That decision forced rapid, deep learning across completely new territory: industrial capacitor ratings, kVAR sizing under real constraints, controller programming, contactor selection, safe on-site work practices, and sourcing from distant distributors. The connections weren’t always obvious at first, but every topic I researched strengthened my overall electrical engineering foundation and made me more versatile for future automation and mechatronics challenges.
One practical lesson came from reverse-engineering the old, dead automatic bank at Plant 1. By carefully documenting its original layout, wiring, controller, and contactor ratings, I was able to propose a realistic BOM for a new automatic bank at Plant 2. In the end the client chose the fixed option for cost reasons, so I built a large fixed capacitor bank from scratch — sourcing cabinet, contactors, breakers, capacitors, transformer, fans, and filters from a single supplier, plus mounting rails and brackets from a local hardware store.
The fixed bank could have been improved significantly: buzzbars for cleaner power distribution, segmentation breakers for safer maintenance, Panduit wire management for a more professional finish, and ideally a full automatic design from the ground up with all the bells and whistles. But time and budget were tight, and I deliberately chose a solution proportional to the problem — good enough to eliminate penalties and earn bonus credits quickly, rather than perfect but delayed and expensive.
Temporary solutions often become permanent, and this one proved no exception. Both banks have performed reliably for over 2 years now. The experience confirmed my preferred approach: dive feet-first into challenging situations, act decisively with the best data available, accept that 80–90 % improvement fast is far better than 100 % much later, and trust that the learning from each project compounds across everything else I do.
This methodology — embracing discomfort, researching aggressively, and tying technical choices to real business outcomes — is how I continue to grow my skills and deliver value in every engineering endeavor.
Business Impact, ROI & Scalability
Business Impact, ROI & Scalability
The installations at both aggregate plants delivered immediate and sustained financial benefits that far exceeded the initial investment.
Penalty Elimination & Bonus Credits
Prior to correction, both sites incurred significant surcharges under CFE’s GDMT tariff for power factors below 90 %. Plant 1 averaged 56.48 % and Plant 2 63.58 %, triggering substantial monthly penalties.
After commissioning:
-
Plant 1 reached a stable 93 % power factor, fully eliminating penalties and qualifying for the good-power-factor bonus (for PF >90 %).
-
Plant 2 achieved 96 %, also removing all surcharges and securing the same bonus.
Bill Impact with Load Growth
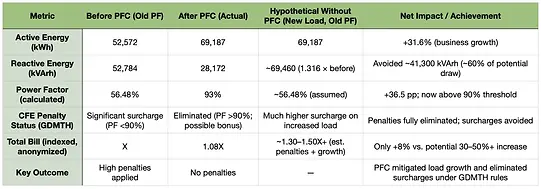
Both plants experienced business growth during the period, increasing active energy consumption:
-
Plant 1: +31.6 % kWh (from 52,572 to 69,187 kWh)
-
Plant 2: +12.5 % kWh (from 52,572 to 59,122 kWh)
Without PFC, the higher load at the old power factors would have produced dramatically higher reactive energy draw and penalties (estimated 30–50 %+ bill increase). Instead:
-
Plant 1’s total bill rose only ~8 % despite 31.6 % more active energy.
-
Plant 2’s total bill actually dropped to ~81 % of the previous level despite 12.5 % load growth.
This represents a net avoidance of massive surcharges while the business expanded — effectively turning a growing cost center into a source of monthly credits.
ROI & Payback
The total investment for Plant 1 (refurbished automatic bank) was $55,646.38 MXN. For Plant 2 (new fixed bank) it was $77,421.06 MXN.
Combined cost: ~$133,067 MXN.
Payback occurred within the first 2 months for both sites through:
-
Complete elimination of penalties
-
Monthly good-power-factor bonus credits
-
Reduced I²R losses and lower peak demand charges due to 30 %+ lower line currents
The systems have operated reliably for years with minimal maintenance, continuing to generate savings and credits on every bill.
Scalability & Future-Proofing
Both designs were intentionally modular and conservative. The Plant 1 automatic bank can be expanded with additional steps if load increases further. The Plant 2 fixed bank can be upgraded to automatic control or paralleled with another bank for larger capacity.
These two installations did not just solve a power factor problem — they mitigated load growth, eliminated recurring costs, generated ongoing credits, and provided a scalable template for future power quality improvements.
Site 1 utility bill after correction
Site 2 utility bill after correction
Utility bill data for Aggregate Plant 1 before and after power factor correction
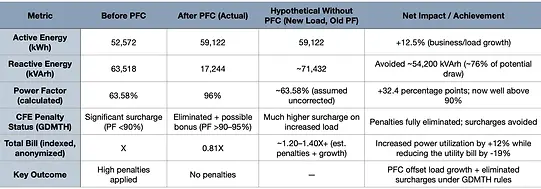
Utility bill data for Aggregate Plant 2 before and after power factor correction